Deploy & Orchestrate
KubeStellar Console isn’t just for monitoring — it’s a full deployment and orchestration control plane for your workloads across multiple clusters.
What Can You Do?
From the Deploy dashboard, you can:
- See all your workloads across every cluster in place
- Create cluster groups to organize where things run
- Deploy workloads by dragging them cluster groups
- Track deployment missions as AI helps you deploy
- Monitor progress with real-time status updates
Think of it like a control tower for your applications. You see everything, and you can move things around.
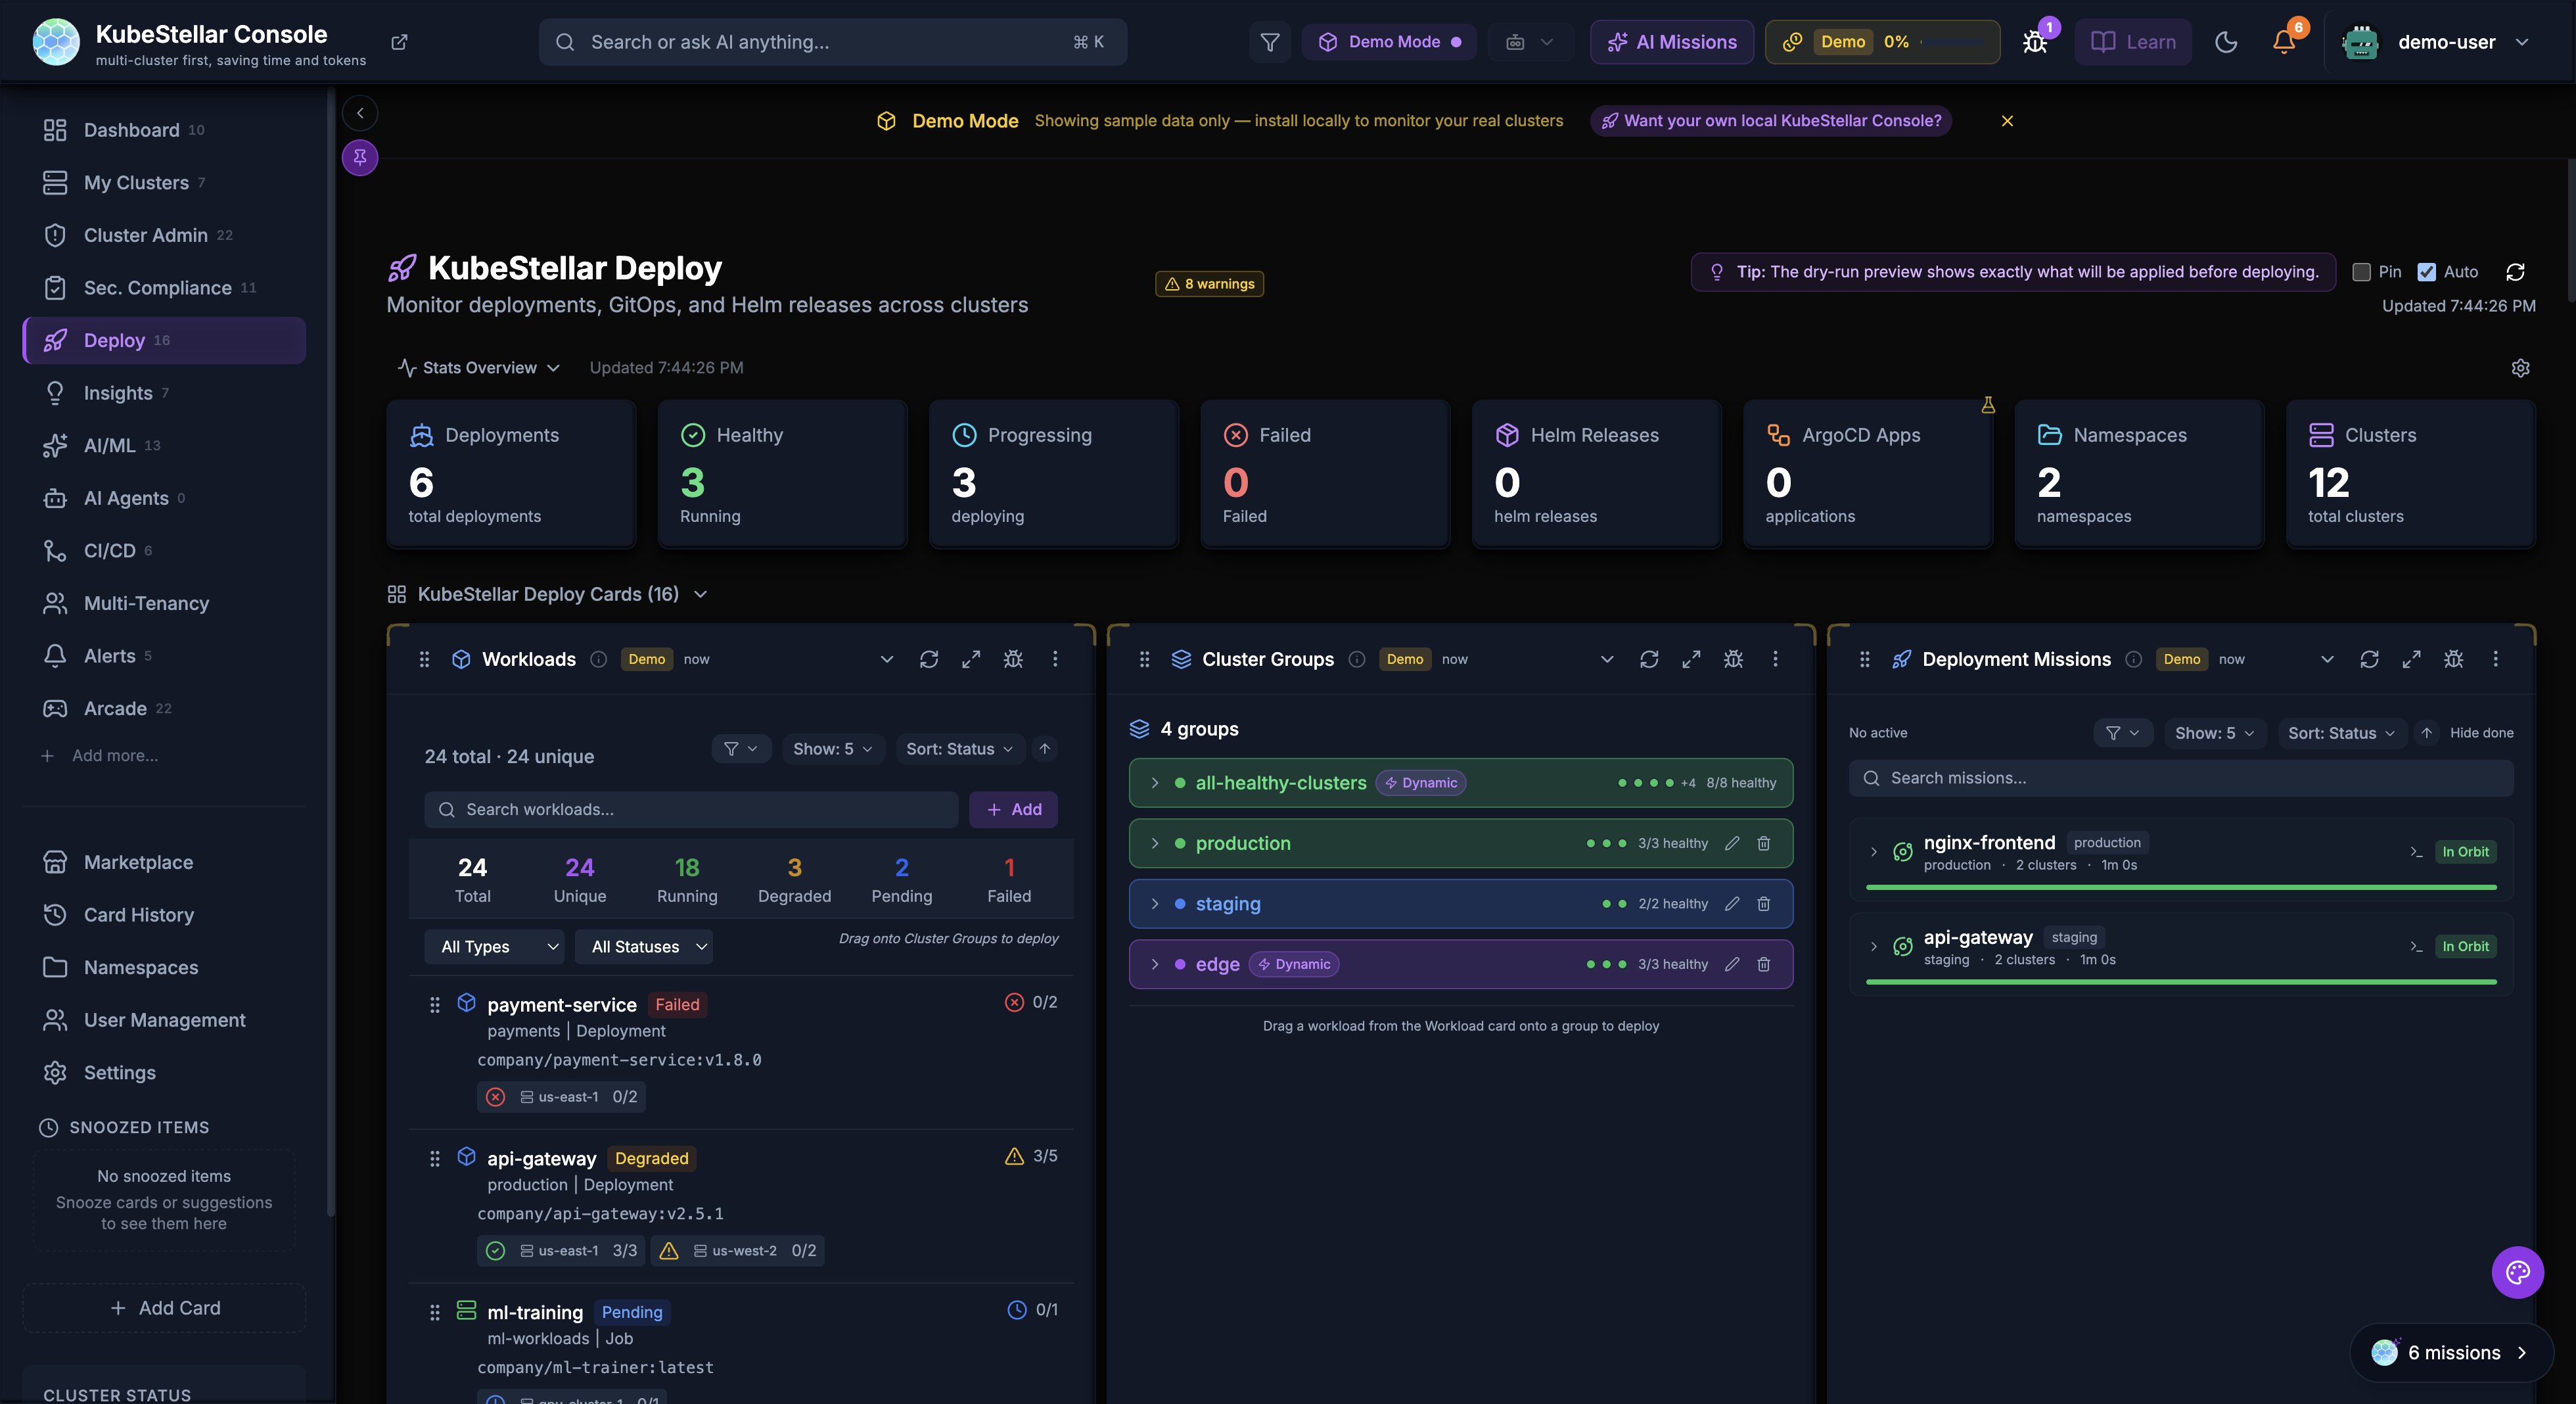
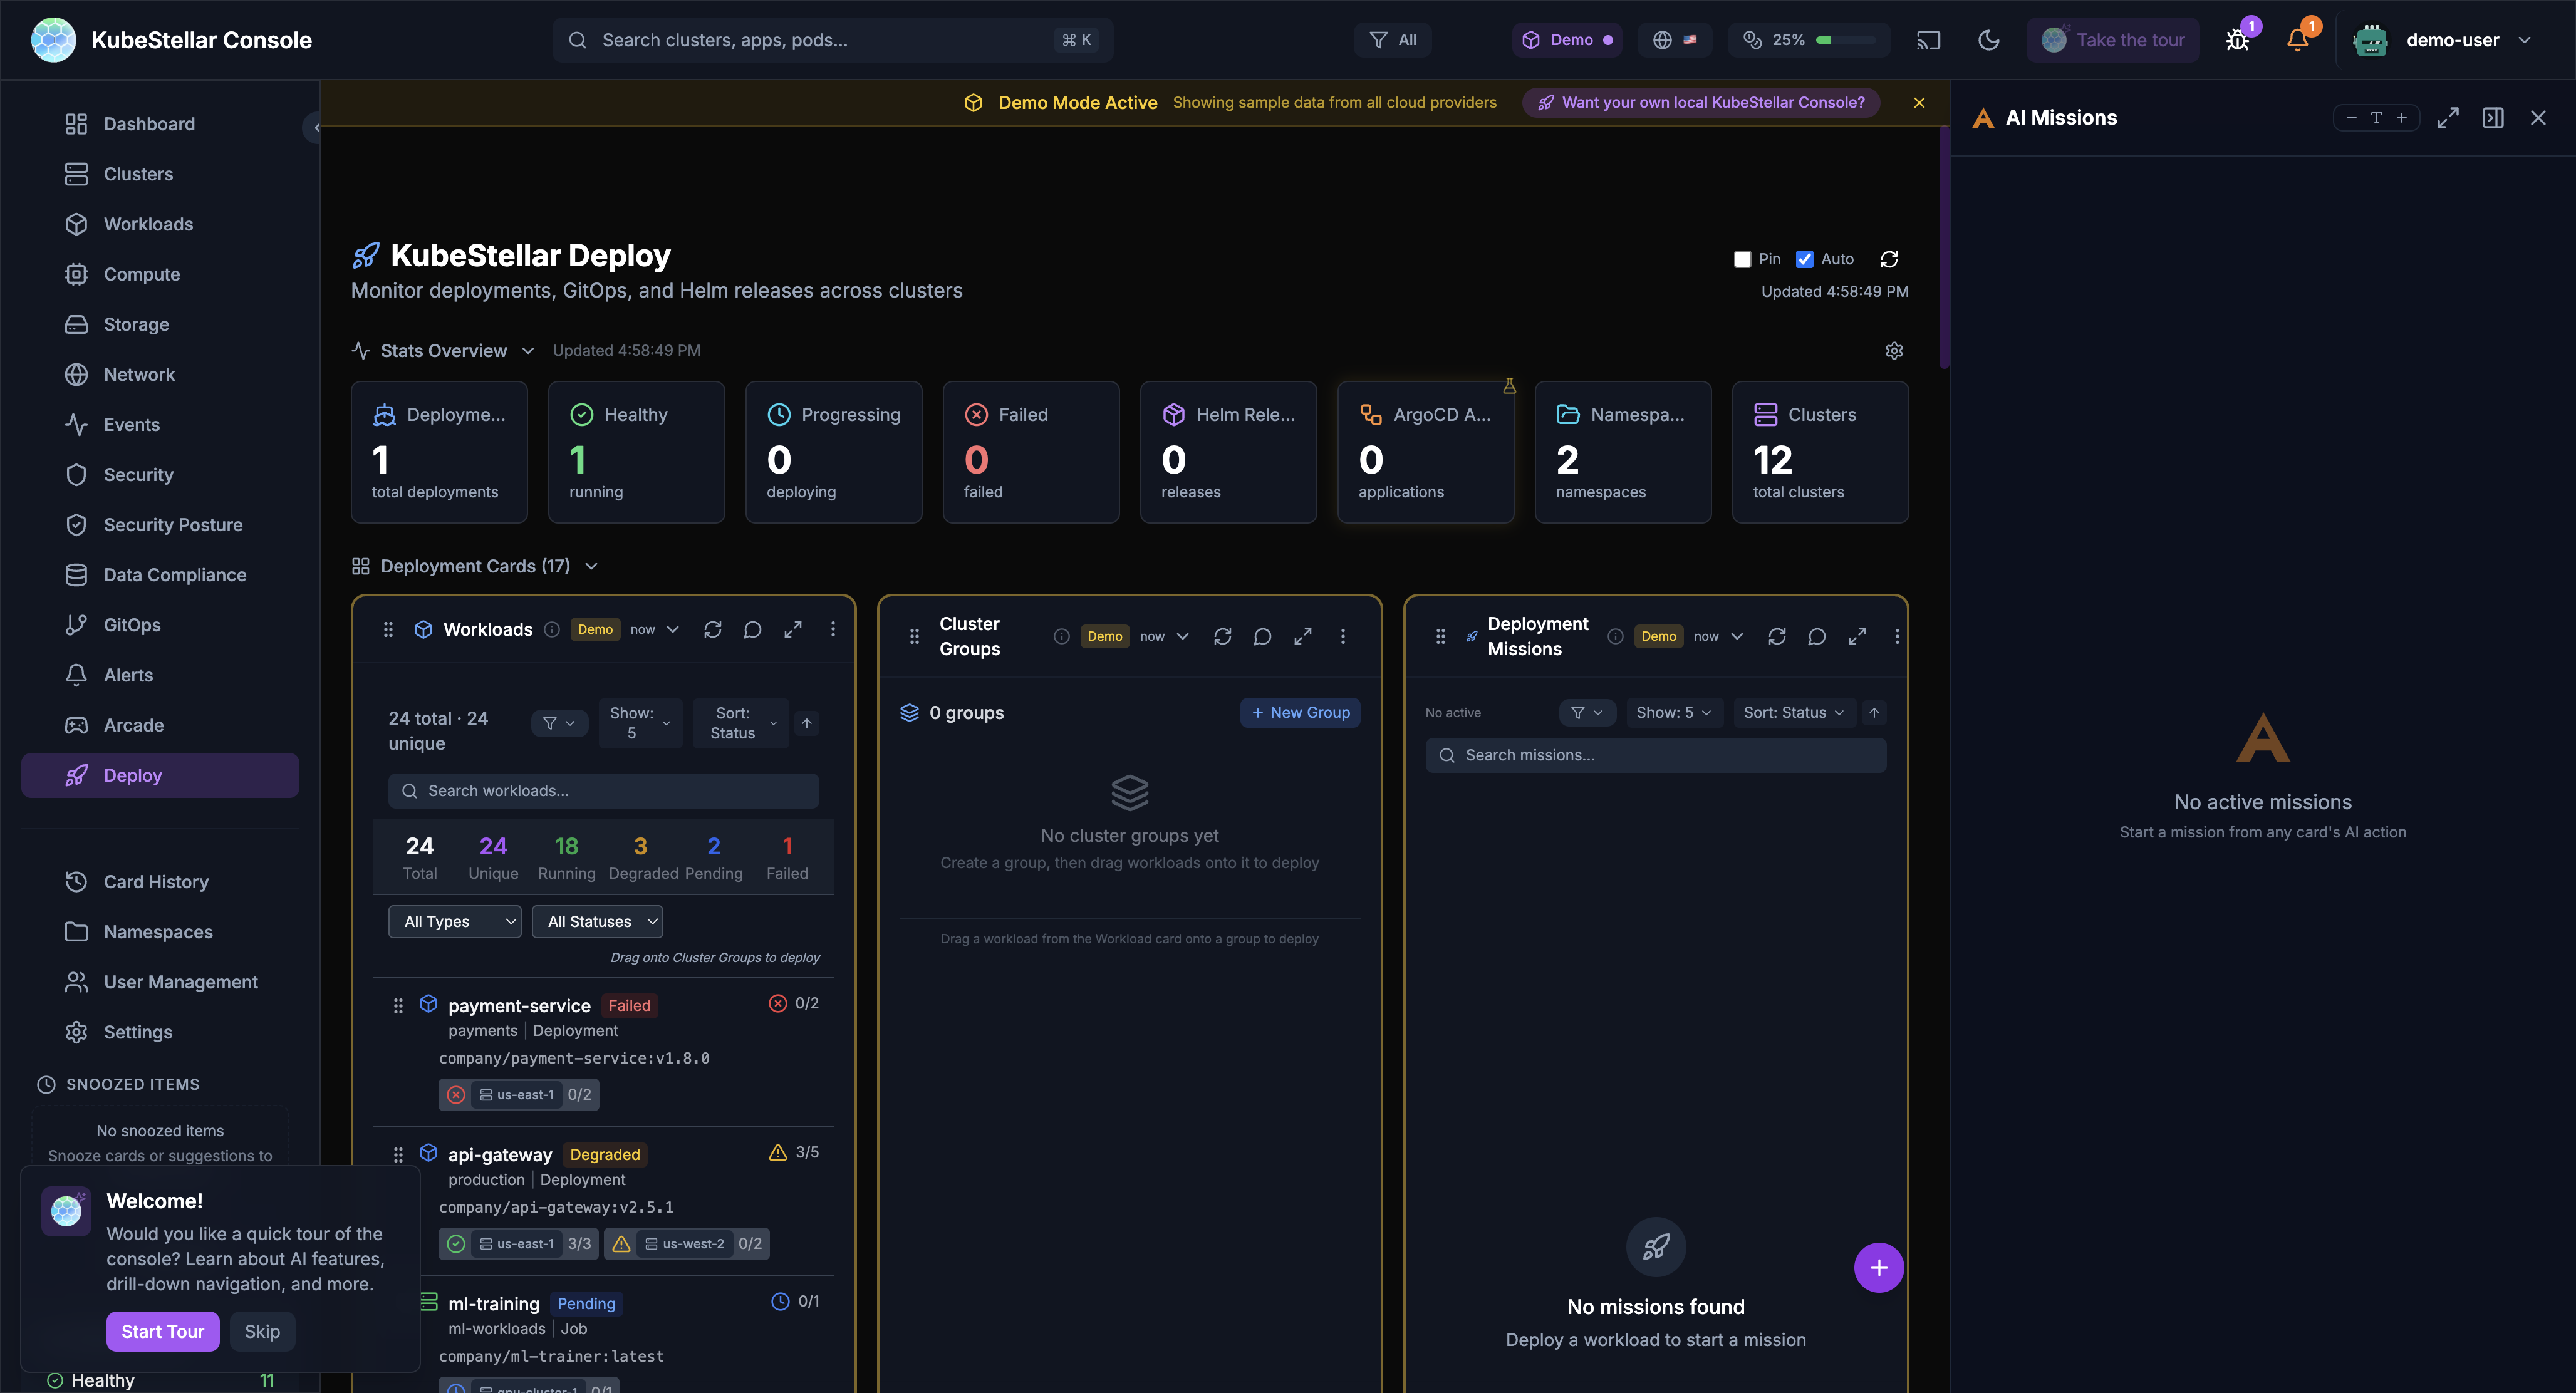
The Three Panels
The Deploy dashboard has three main panels that work together:
1. Workloads
The left panel shows all your workloads across all clusters:
- Total count and unique workloads
- Status breakdown — Running, Stopped, Degraded, Pending, Failed
- Filter and search by type, status, or name
- Click any workload to see its details, containers, and deployment history
Each workload shows:
- Name and namespace
- Current status (with color coding)
- Which clusters it runs on
- Container count and resource usage
2. Cluster Groups
The middle panel lets you organize clusters into groups:
- Create a group — Click ”+ New Group” and pick which clusters belong
- Name your groups — Like “production”, “staging”, “us-east”, “gpu-nodes”
- Drag and drop — Drag a workload from the left panel a group to deploy it there
Cluster groups make it easy to deploy the same workload to multiple clusters at. Instead of deploying to each cluster by, just drop it on the group.
3. Deployment Missions
The right panel tracks your deployment operations:
- AI-assisted deployments — AI helps plan and execute deployments
- Mission status — See what’s deploying, what succeeded, what failed
- History — Review past deployments
How to Deploy a Workload
Step 1: Create a Cluster Group
- Click ”+ New Group” in the Cluster Groups panel
- Give it a name (like “production-us”)
- Select which clusters belong to this group
- Save the group
Step 2: Drag a Workload
- Find your workload in the Workloads panel
- Drag it your cluster group
- The console creates a deployment mission
Step 3: AI Takes Over
- AI analyzes the workload requirements
- AI checks cluster capacity and compatibility
- AI creates the deployment plan
- You review and approve
- Deployment happens across all clusters in the group
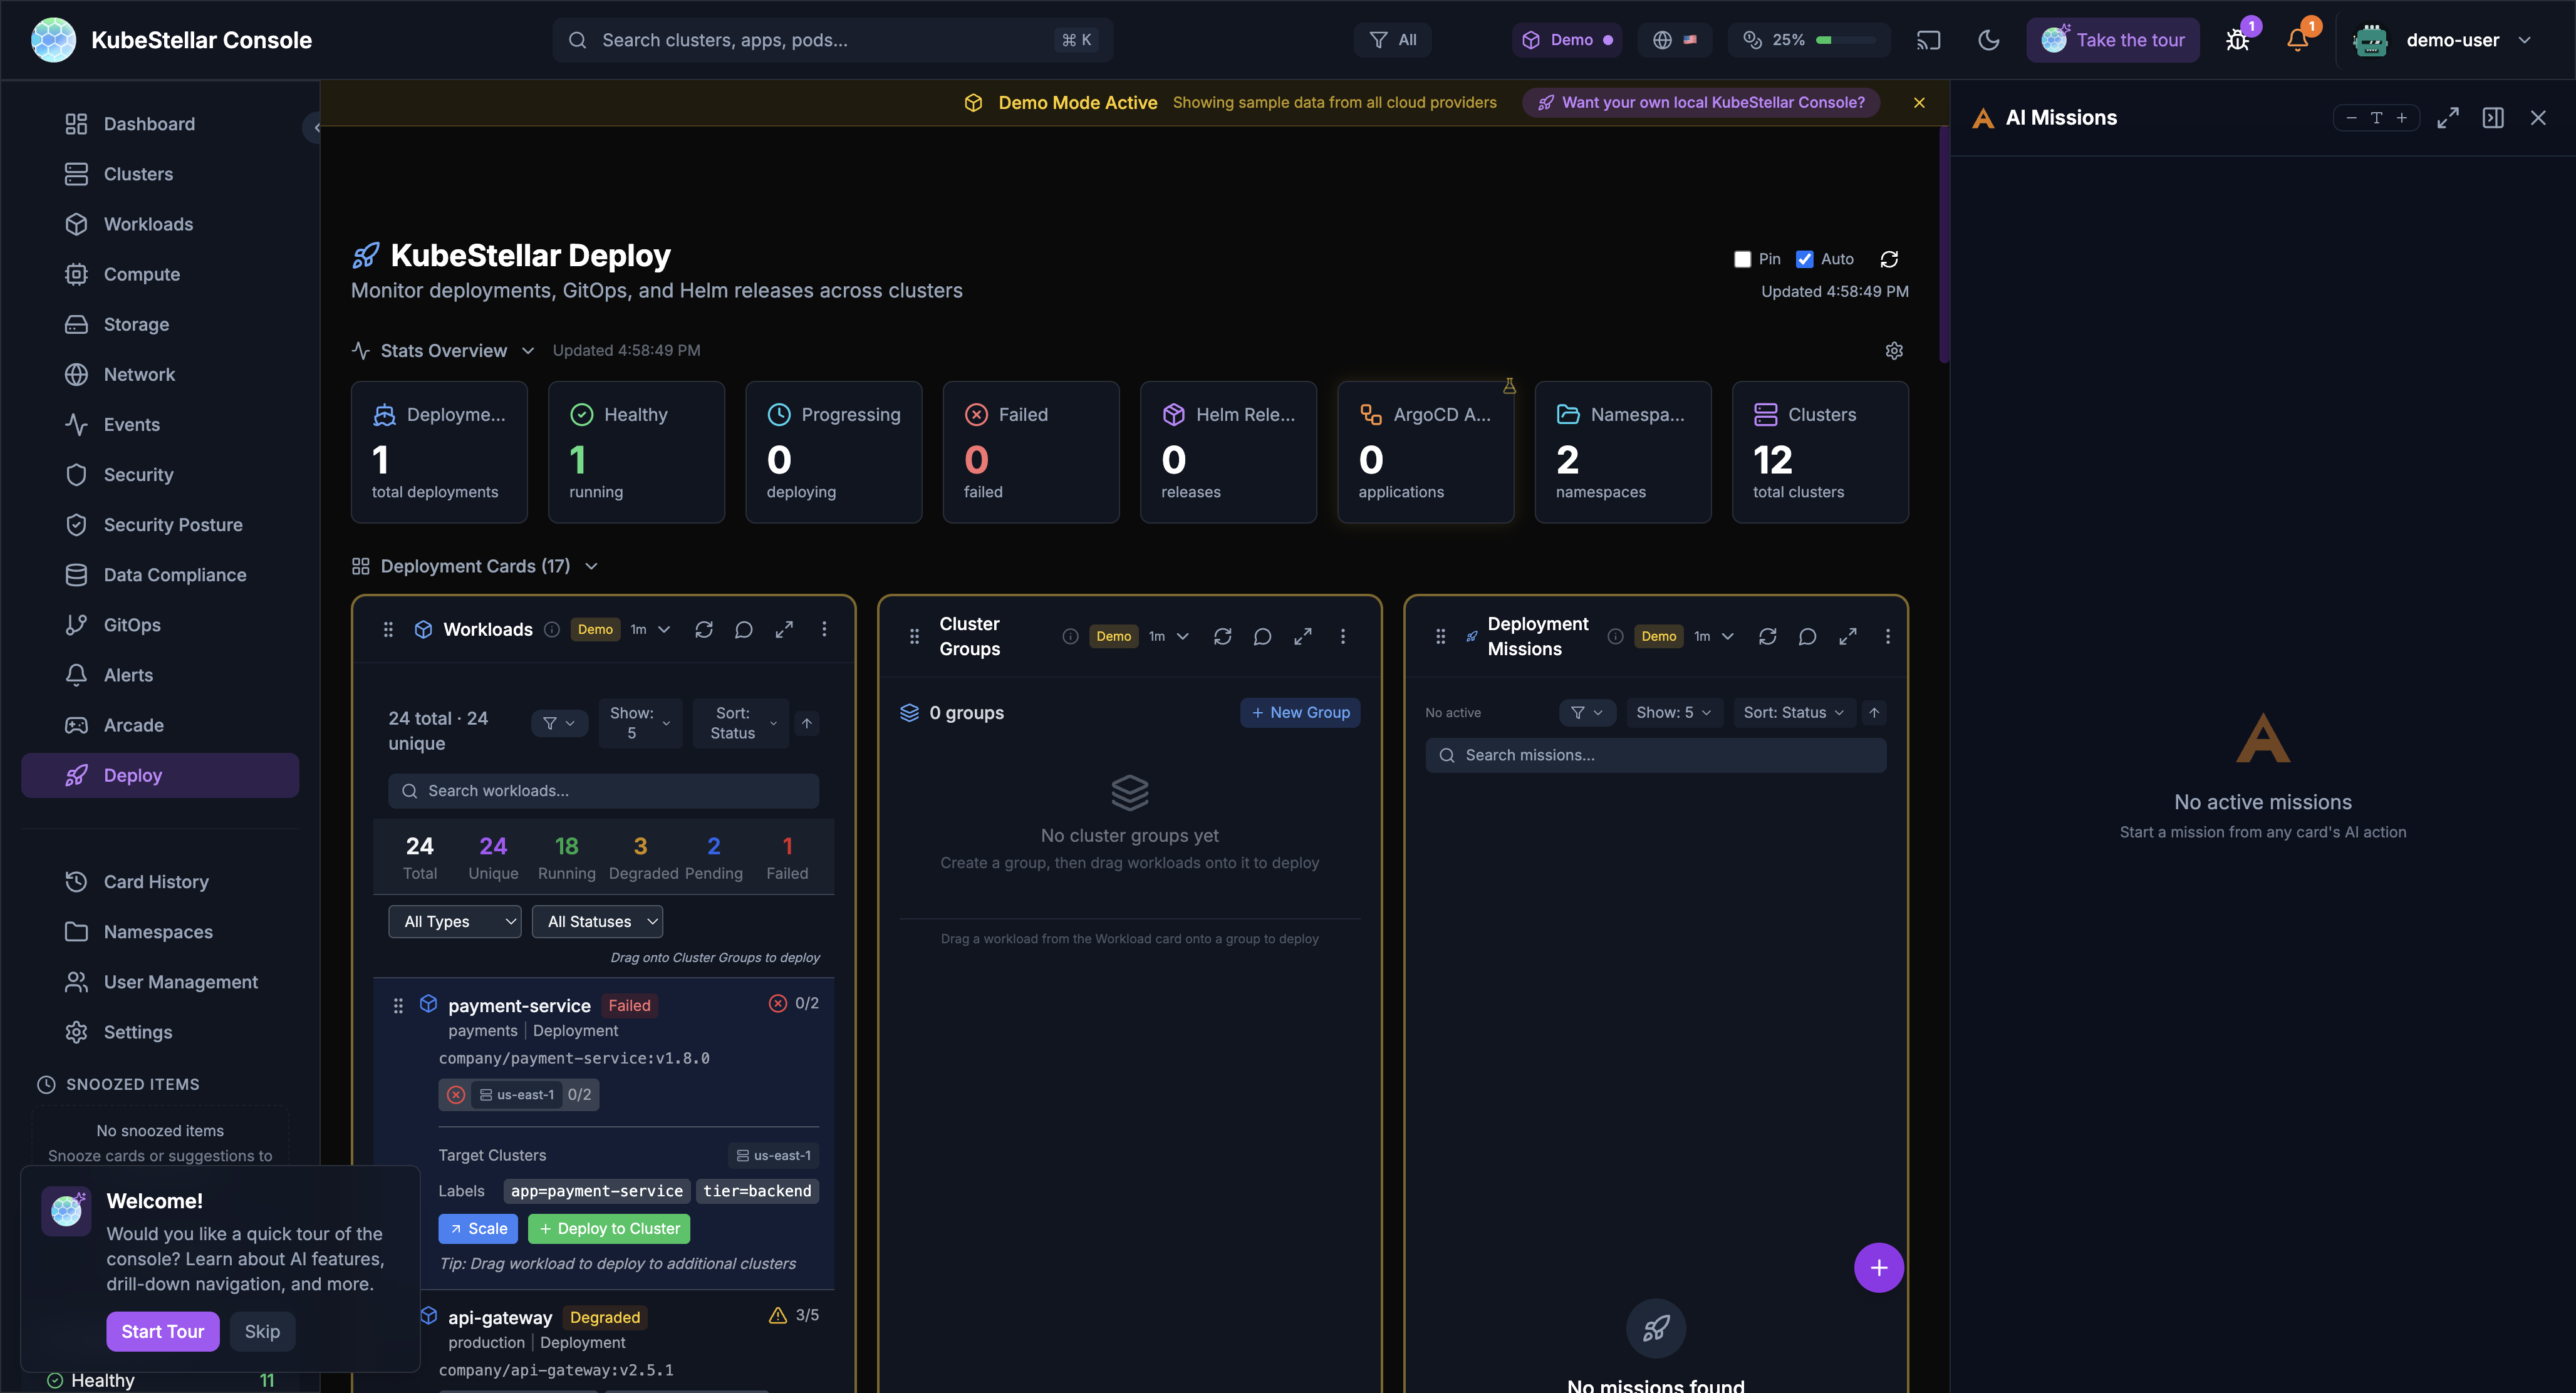
Workload Details
Click any workload to see:
- Deployment details — Replicas, strategy, labels
- Containers — Images, ports, resource limits
- Status across clusters — Where it’s running, where it’s failing
- Events — Recent events related to this workload
- AI Diagnose — Ask AI what’s wrong and how to fix it
Stats at a Glance
The top of the Deploy dashboard shows key numbers:
| Stat | What it means |
|---|---|
| Deployments | Total deployments being managed |
| Healthy | Deployments running without issues |
| Progressing | Deployments currently rolling out |
| Failed | Deployments that need attention |
| Helm Releases | Helm-managed deployments |
| ArgoCD Apps | ArgoCD-managed applications |
| Namespaces | Namespaces in use |
| Clusters | Total clusters available |
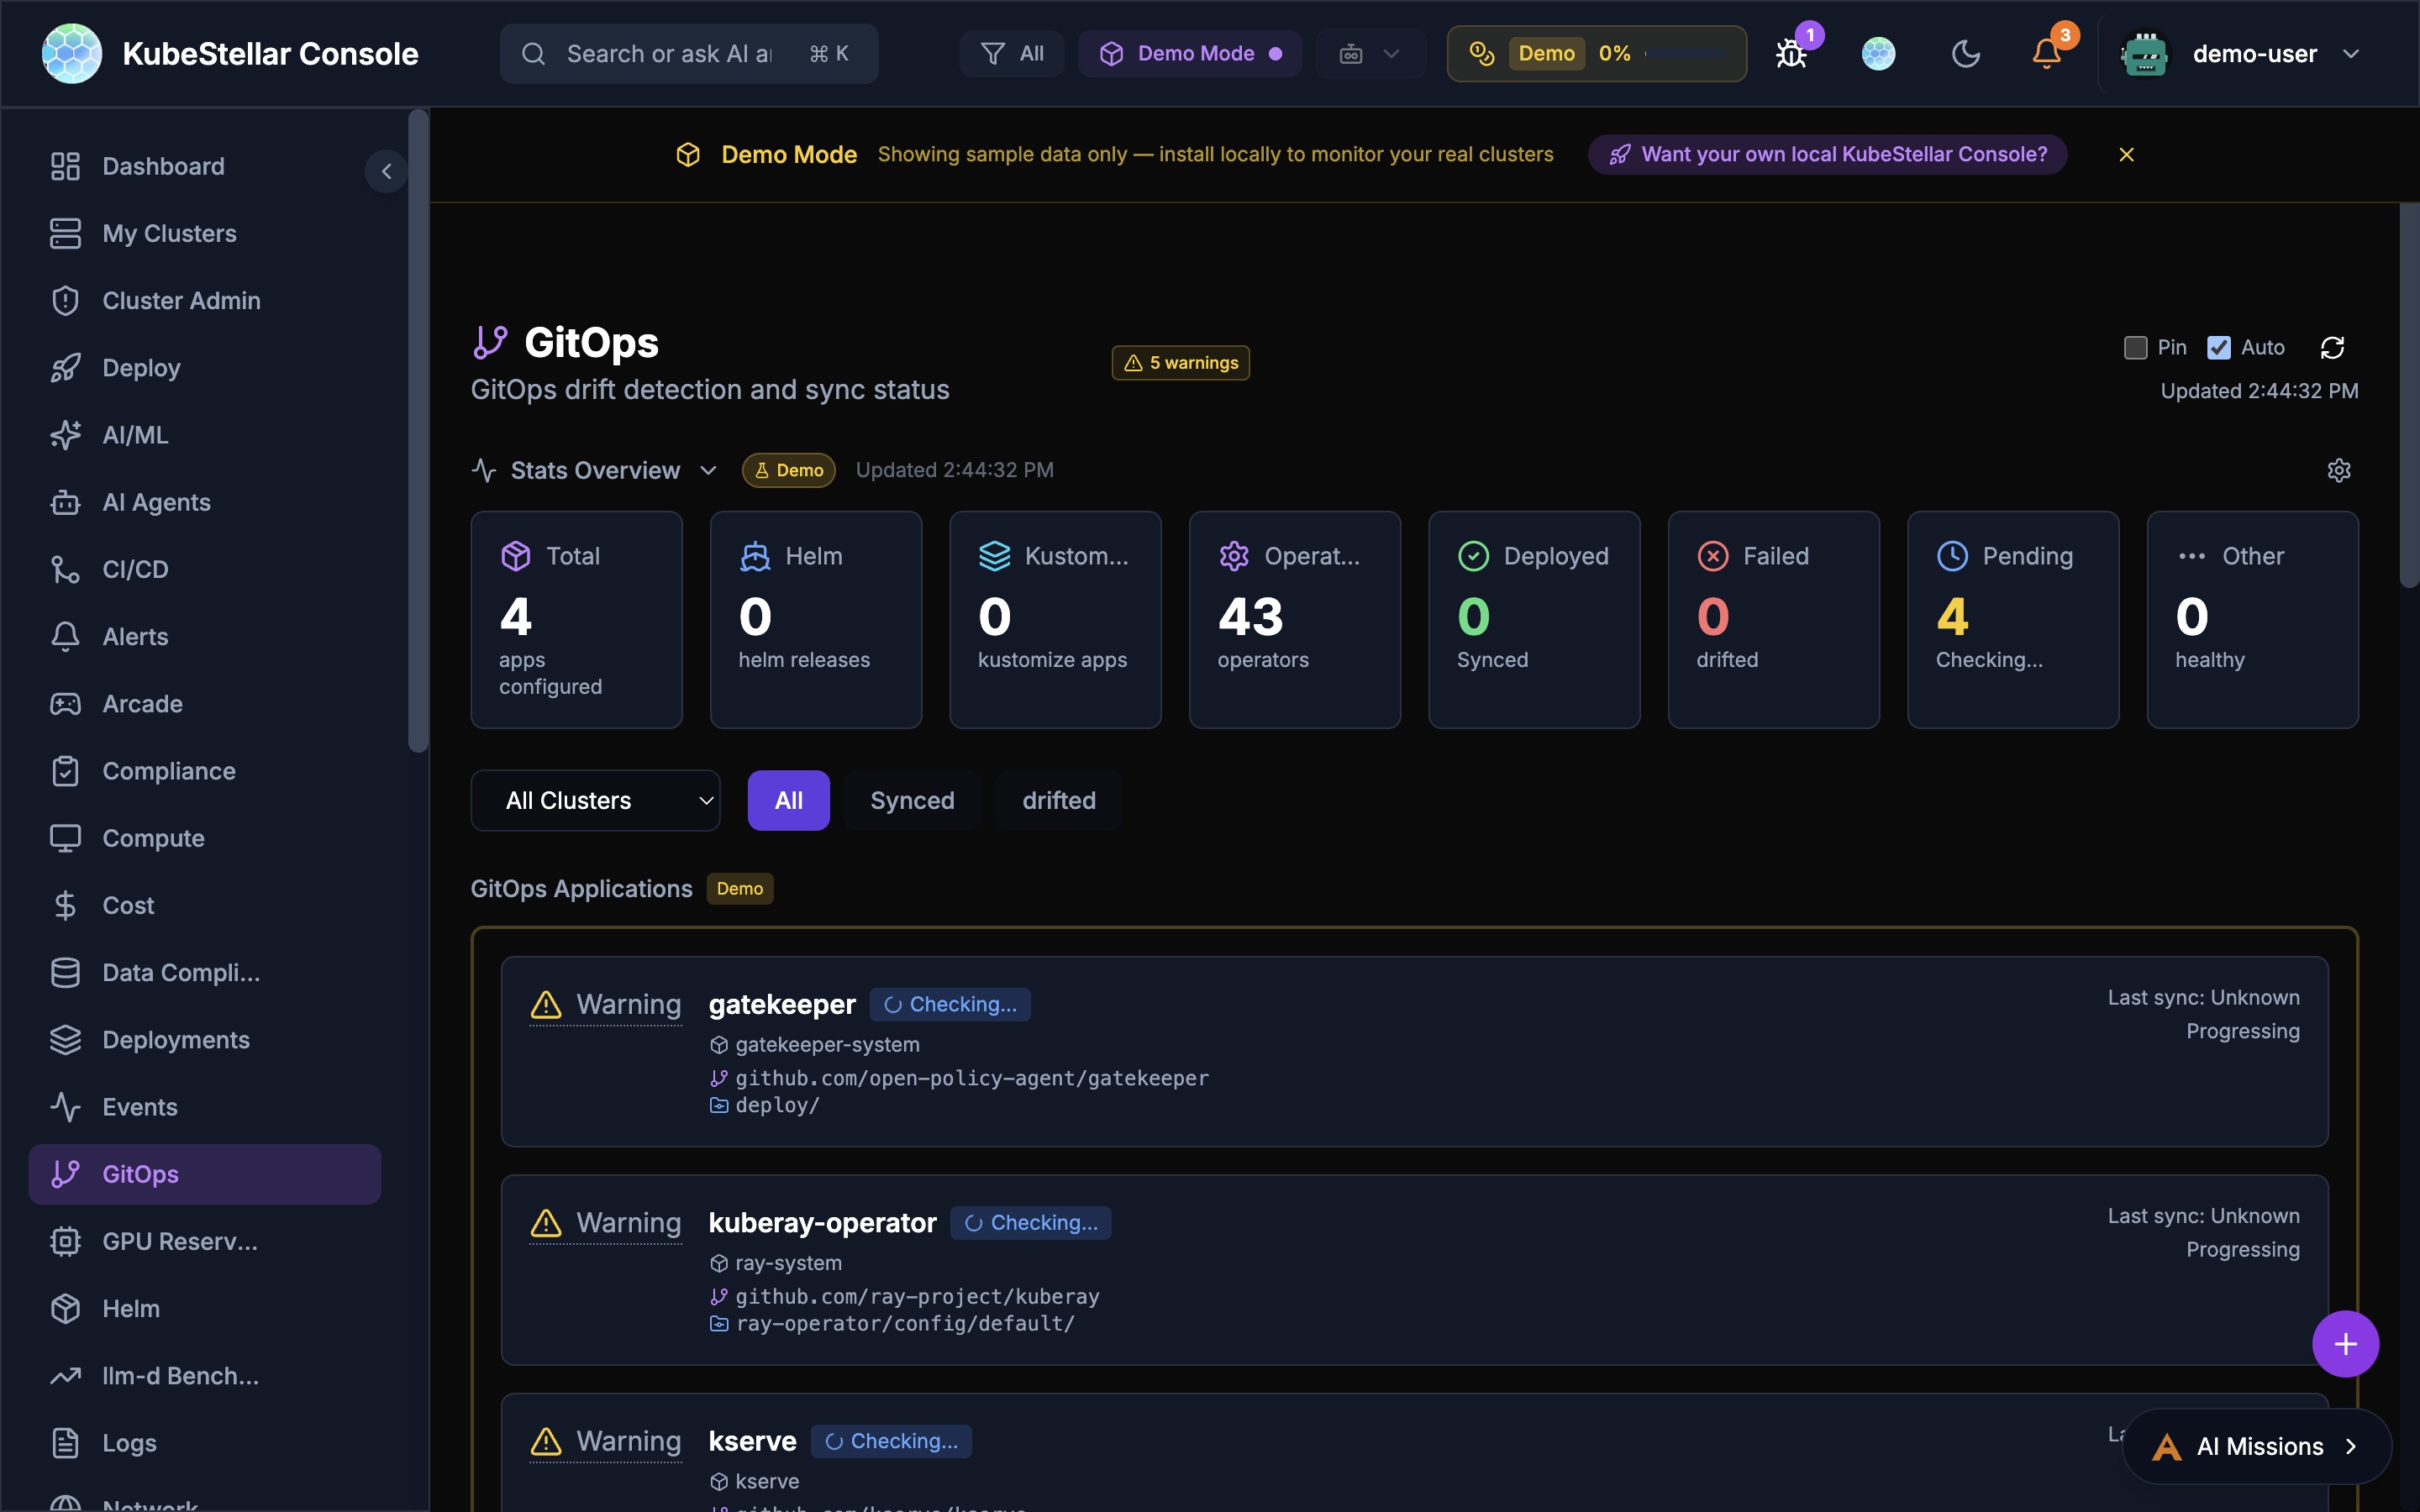
GitOps Integration
The Deploy dashboard also integrates with GitOps tools:
- Helm releases — See all Helm charts deployed across clusters
- ArgoCD applications — Monitor ArgoCD sync status
- Kustomizations — Track Kustomize-based deployments
This means you can use the console alongside your existing GitOps workflow, or as a standalone deployment tool.
Workload Import Dialog (New in April 2026)
The Deploy page now includes an Add Workload button that opens a multi-tab import dialog for adding new workloads:
| Tab | Method |
|---|---|
| YAML | Paste or upload YAML manifests. Supports multi-document YAML with client-side validation via js-yaml. |
| Helm | Import from a Helm chart repository. |
| GitHub | Import directly from a GitHub repository URL. |
| Kustomize | Apply a Kustomize overlay. |
The ”+ Add” button sits inline with the workload search bar for easy access.
Orbit Status on Deployment Missions (New in April 2026)
When a deployment is “In Orbit” (successfully deployed) and has an associated orbit maintenance mission, the Deployment Missions card shows:
- Orbit icon with cadence label (daily/weekly/monthly)
- Last run result — success, warning, or failure indicator
- “Overdue” flag when maintenance is past its scheduled cadence
This connects the deployment lifecycle to maintenance, so you can see at a glance whether deployed applications are being actively maintained.
See AI Features > Orbital Maintenance for full documentation on orbit missions.
Why Use This?
Before: Cluster at a Time
Without the console, deploying to multiple clusters means:
- Switch kubeconfig context
- Run kubectl apply
- Switch to next cluster
- Repeat for every cluster
- Hope nothing went wrong
After: All Clusters at
With the console:
- Create a cluster group
- Drag your workload it
- Done — AI handles the rest
Tips
- Start with groups — Create cluster groups that match how you think about your infrastructure (by region, environment, or purpose)
- Use AI — Let AI diagnose failed deployments instead of digging through logs manually
- Watch the missions — The Deployment Missions panel shows you exactly what’s happening
- Filter workloads — Use the status filters to focus on what needs attention (Failed, Degraded, Pending)
Mission Browser (New in March 2026)
The Deploy page now includes a full-featured Mission Browser for discovering, managing, and sharing deployment missions.
Installer and Solution Tabs
The Mission Browser organizes missions into two primary tabs:
- Installer: Pre-built missions for installing infrastructure components — Helm charts, operators, CNCF projects, and common tools
- Solution: End-to-end solution missions that combine multiple components into a complete deployment (e.g., “Deploy a full observability stack” which installs Prometheus, Grafana, and alerting rules together)
Progressive Loading
Missions load incrementally with shimmer skeleton placeholders:
- The browser renders immediately with anatomically correct loading skeletons
- Missions appear as they load, avoiding the “blank screen” experience
- Lazy Knowledge Base matching provides import suggestions as the catalog is indexed
Deep-Linking and Sharing
Every mission has a unique, shareable URL:
- Deep-links preserve query parameters through the OAuth login flow
- Share a mission URL with a teammate, and they land directly on that mission after authenticating
- Import missions from shared links with-click import
- AI-powered recommendations suggest related missions
Saved Missions Panel
Quick-access panel for previously saved missions:
- Pin frequently-used missions
- Quick-deploy with last-used configuration
- Sort by recent use or alphabetically
Declarative GitOps Restart (Argo CD)
The GitOps dashboard now includes enhanced Argo CD integration for declarative application restarts.
Sync Now Button
The Argo CD application card now features a Sync Now action button:
- Triggers an immediate sync of the selected ArgoCD application
- Shows real-time sync progress with status updates
- Supports both single-app and bulk sync operations
GitOps Restart Tab
A new tab in the Argo CD application drilldown provides restart capabilities:
- Rolling restart: Triggers a rolling restart of all pods managed by the application
- Strategy selection: Choose between RollingUpdate or Recreate strategies
- Restart history: View past restarts with timestamps, initiator, and outcome
- Alert integration: Failed restarts automatically create alerts for follow-up